

Analytics & Reports
The Analytics page in the sidebar summarizes your return activity so you can move from reacting to individual returns to fixing the patterns behind them. This guide explains each report and how to act on it.
Choosing a Date Range
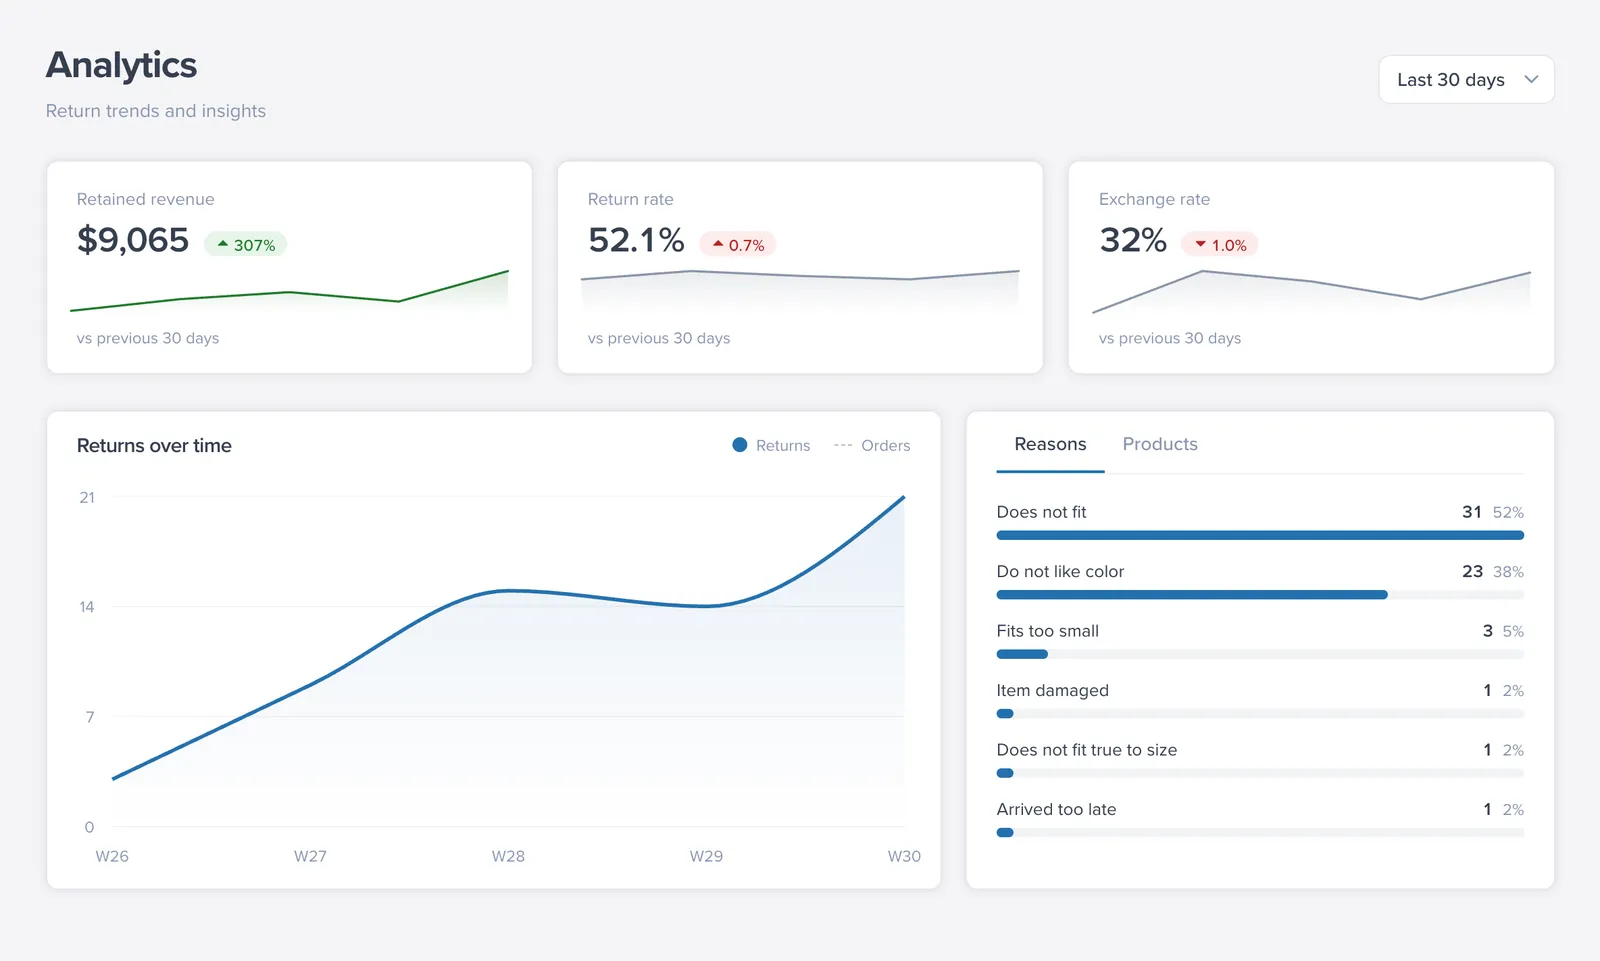
At the top of the page, pick the period to analyze: Last 7 days, Last 30 days, Last 90 days, or All time. All cards and charts update to the selected range, and key metrics are compared against the previous period so you can see movement.
Key Metrics
Three headline cards sit at the top:
Returns Over Time
The Returns over time chart plots Returns against Orders for the period. Because both lines are on the same chart, you can tell the difference between “returns are up because sales are up” (both rise together) and a genuine problem (returns rising while orders are flat).
Return Reasons Breakdown
The reasons chart shows which return reasons customers pick most. Use it to:
- Fix product content — a dominant “looks different to image on site” or sizing-related reason points at photography or size-chart fixes.
- Tune your reason list — if one vague reason (like “Others”) dominates, add more specific reasons so the data becomes actionable. Manage reasons in Settings — see Configure Return Policies.
- Target flows — reasons that signal your fault (damaged, wrong item) are good candidates for photo requirements and deduction waivers.
Top Returned Products
The products chart ranks your most-returned products. A product that appears here repeatedly deserves investigation: a sizing issue, a quality problem with a batch, or a misleading listing. For extreme cases, consider a non-returnable tag, a Require Approval flow for that SKU, or blocking specific outcomes — see Automate Returns with Flows.
Turning Insights into Action
A simple monthly loop:
- Check Return rate and Returns over time for overall direction.
- Drill into the top reason and top product; fix listings or quality issues at the source.
- Adjust policy or flows accordingly, and confirm next month that the numbers moved.
FAQ
How often does analytics data update?
Cards and charts refresh for the selected date range and are compared against the previous period. If you are newly launched, some views may stay sparse until enough return activity accumulates.
Why am I seeing 'No returns yet' or limited charts?
This usually means your store has not generated enough return events in the selected period. Expand the date range to All time and check again.
What should I review first each month?
Start with Return rate and then investigate the top return reason and top returned product before updating policy or flows.